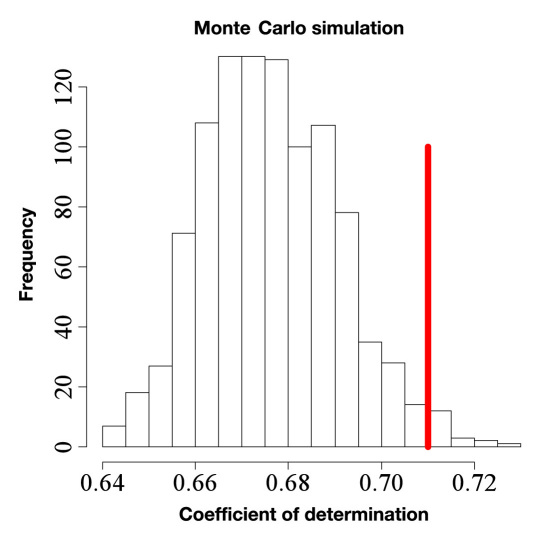
Figure 7.
Simulated coefficients of determination (R2) of models with individual coefficients for randomly chosen subsets of runs (same sizes as the personal subsets). The vertical line shows the R2 of the personalized model (0.71). For the Monte Carlo simulated models, 1.8% have a higher R2 than the personalized model.

