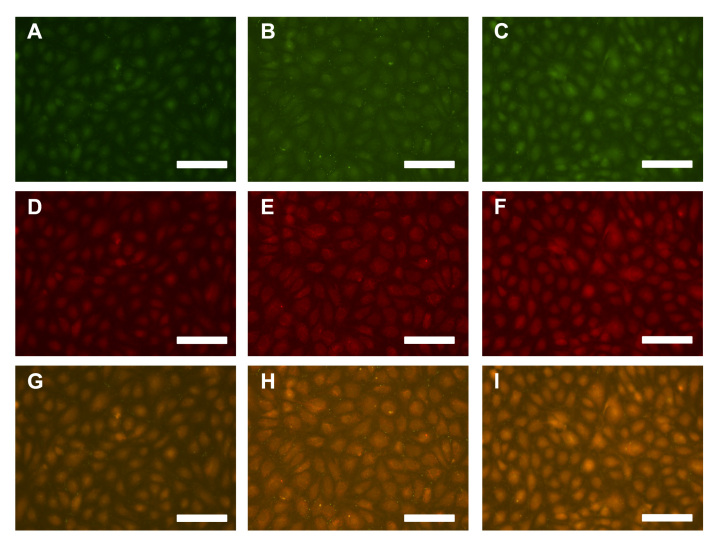
Figure 6.
Digital images of endothelial cells exposed to (A, D, G) no added albumin, (B, E, H) albumin glycated for 8 weeks, (C, F, I) or nonglycated albumin at 8 weeks for 5 days. The expression of (A, B, C) connexin-43 and (D, E, F) caveolin-1 were quantified as a means to determine changes in angiogenesis potential and gap junction formation (these images generated the data plotted in Figures 5A and 5B). (G, H, I) Merged images show where these markers were localized under these conditions and suggest that these were nature channels (these images were generated the data plotted in Figures 5C and 5D). All scale bars are 100μm.

