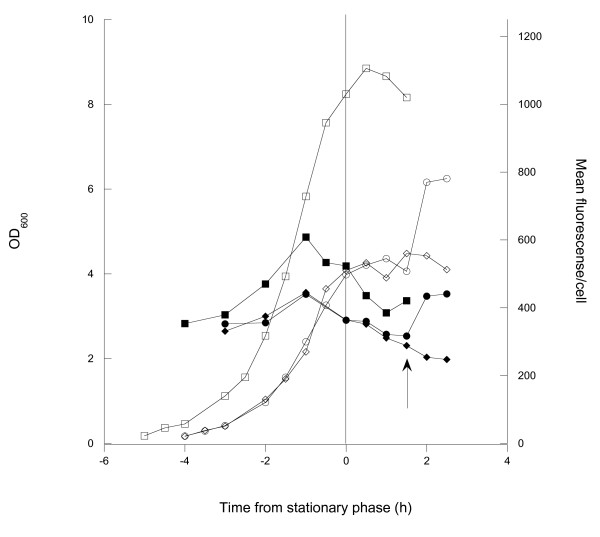
Figure 3.
Effects of carbon starvation on surface expression. Shake flask cultivations of 0:17ΔOmpT showing growth and surface expression of the Z protein in relation to the entry into stationary phase. Three cultivations are shown: one with 10 g l-1 initial glucose (squares) and two with 3 g l-1 initial glucose (circles and diamonds). Open symbols show cell growth measured by optical density and filled symbols show surface expression measured by flow cytometry. Arrow: a second addition of glucose was made to one of the two flasks with low starting glucose (circles). All curves are normalized to enter stationary phase simultaneously, and the entry into the stationary phase is marked with a vertical line.

