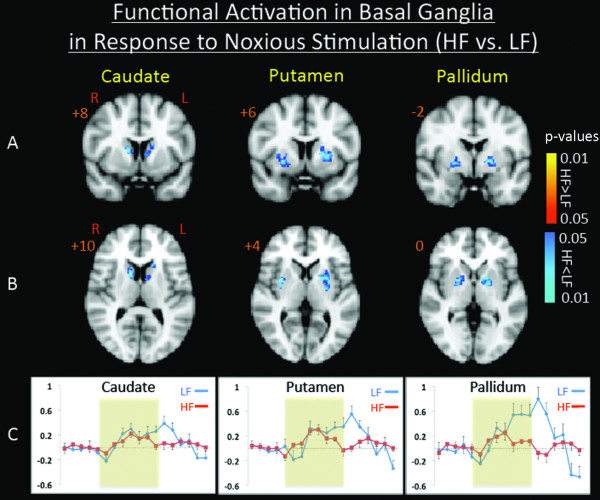
Figure 2.
Contrast Maps for Painful Heat fMRI Activation. Contrast analysis of the HF vs. LF migraine group in response to the "pain threshold +1°C" stimuli revealed significant (p < 0.05, corrected) differences in the basal ganglia nuclei in coronal (A) and axial (B) views. In (C) Single trial averages for the response to painful heat stimulation in caudate, putamen, and pallidum are presented. Yellow represents the stimulus application period.

