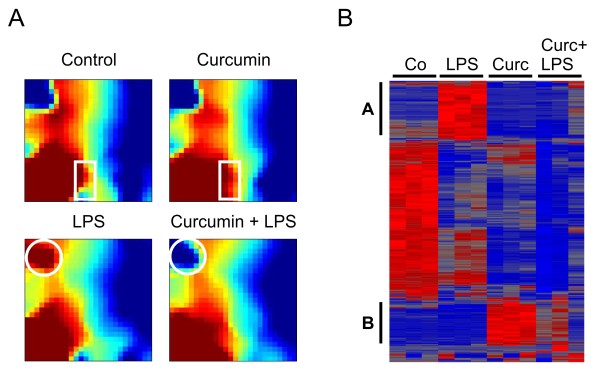
Figure 1.
Curcumin influences global gene expression in resting and LPS-activated BV-2 microglial cells. (A) Gene Expression Dynamics Inspector (GEDI) analysis of the complete DNA-microarray dataset from control BV-2 cells or cells treated with 20 μM curcumin, 100 ng/ml LPS, or 20 μM curcumin + 100 ng/ml LPS for 6 hours. The white rectangles and circles denote the most prominent expression changes in corresponding gene clusters. (B) Hierarchical clustering of normalized expression levels after one-way ANOVA at p < 0.01. Triplicate microarrays were analyzed for each condition and the pseudo-color scale indicates high (red) or low (blue) expression levels. LPS and curcumin-related clusters are marked with A and B, respectively.

