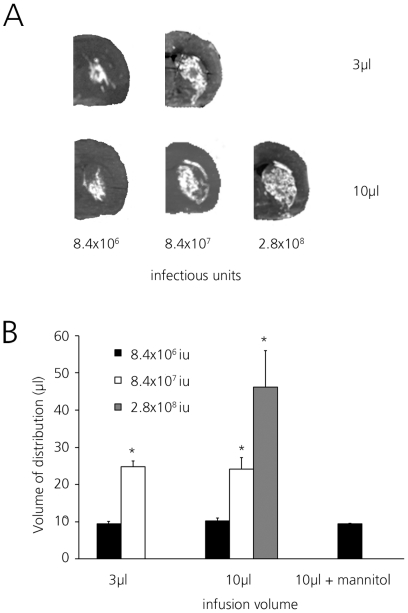
Figure 1. Volumes of distribution (Vd) of adenoviral transgene expression in rat striate.
GFP expression following 3 µl (left side) or 10 µl infusion (right side) of AdGFP as detected by fluorescence imaging using IVIS lumina imaging system. Vd was calculated from serial slides by determining GFP expression. (A) Distribution after infusion of AdGFP in 3 µl (upper) or 10 µl (lower) at increasing dose as determined by IVIS fluorescence. Representative sections from rat hemispheres are shown. (B) Vd of AdGFP infused in either 3 µl or 10 µl with increasing dose. 8.4*106 iu (black bars), 8.4*107 iu (white bars) and 2.8*108 iu (gray bars). Differences between 3 µl and 10 µl infusion volume at similar doses were not significant. Mannitol did not increase Vd. Average Vd ± SD is shown, * p<0.01 compared to lower dose.

