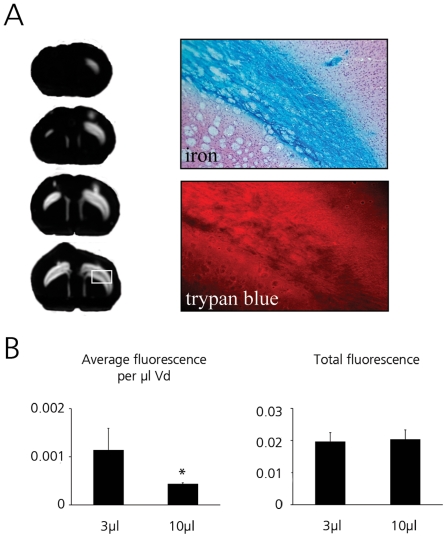
Figure 5. Determination of fluorescence of trypan blue and SPIO distribution following CED into the external capsule.
Trypan blue fluorescence was detected using the IVIS Lumina system and by fluorescent microscopy. Fluorescence was quantified using ImageJ software. (A) Trypan blue is detected in the gray matter surrounding the corpus callosum, while SPIO is confined to the corpus callosum. Trypan blue is easily detected using fluorescent imaging. Both IVIS imaging (left) and microscopy fluorescence imaging (lower right panel, showing magnified view of the area marked white in left panel) yield similar distribution patterns. Image shows coronal sections through rat brain. Fluorescence signal showing in white. Right side 10 µl infusion, left side 3 µl infusion. Upper right panel shows corresponding HE & iron staining in parallel section, showing SPIO distribution confined to the corpus callosum and external capsule (original magnification 5×). (B) Trypan blue fluorescence used to determine if CED was successful. Average fluorescence per µl distribution volume is decreased on the 10 µl side due to the larger Vd. Total fluorescence in both groups is similar indicating equal delivered dose. Average fluorescence ± SD is shown.

