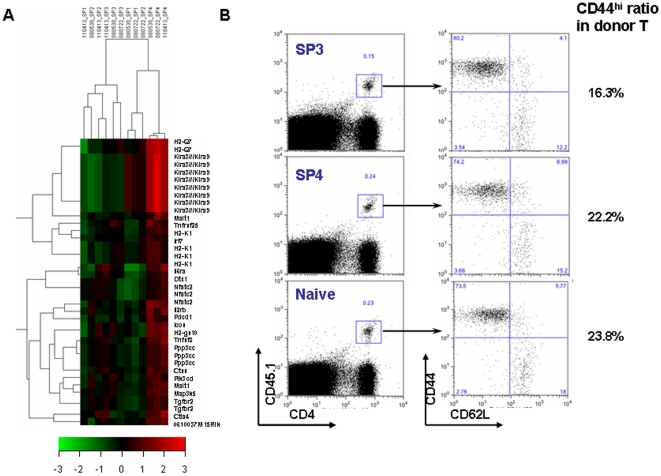
Figure 5. CD4 SP thymocytes gradually acquire immuno-competence.
(A) Expression profiles of the immune-related genes among the four subsets. The profile was generated by hierarchical clustering using GeneCluster 2.0 package. All data from three array repeats were shown (080530_SPx, 080722_SPx, and 110413_SPx, x represents 1 to 4). Red represents up-regulation of gene expression, and green represents down regulation of gene expression. The entire list of genes is available in Table S2. (B) Similar activation of SP3, SP4 thymocytes and naïve CD4+ T cells upon Listeria Monocytogenes (Lm) infection. Purified SP3, SP4 thymocytes and naïve CD4+ T cells from C57BL/6 Ly5.1 congenic mice were adoptively transferred into C57BL/6 Ly5.2 mice (9×10⁶ per host mouse). One day later, the host mice were challenged with 2×10⁴ live Lm via tail vein injection. On day 7 of the infection, the cells from the lymph nodes and spleens were harvested and stained with CD45.1, CD4, CD44, and CD62L. The donor cells with the expression of both CD45.1 and CD4 are gated (shown in left paneal). The expression of CD44 and CD62L of donor cells (CD45.1+CD4+) are shown on the right panel.

