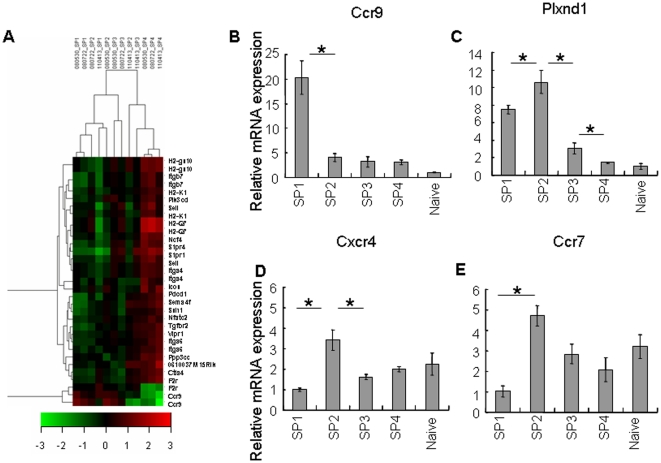
Figure 6. Molecular basis of the adhesion and migration of CD4 SP thymocytes during their final maturation process.
(A) Expression profiles of the adhesion/migration-related genes among the four subsets. The profile was generated by hierarchical clustering using GeneCluster 2.0 package. All data from three array repeats were shown (080530_SPx, 080722_SPx, and 110413_SPx, x represents 1 to 4). Red represents up-regulation of gene expression, and green represents down regulation of gene expression. The entire list of genes is available in Table S2. (B–D) Gene expression of chemotactic molecules that have been reported to change after positive selection. Relative mRNA level of Plxnd1 (B), Ccr9 (C), Cxcr4 (D), and Ccr7 (E) in the four subsets of CD4 SP thymocytes as determined by qRT-PCR. Asterisks indicate significant (p<0.05) changes compared between the two subsets. Three experiments were performed on RNAs from three independently isolated cell populations for each thymocyte subset and similar results were seen.

