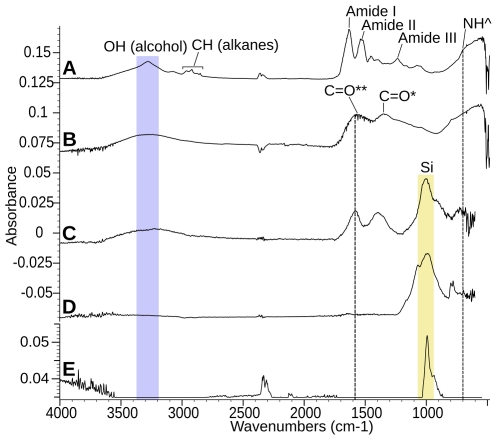
Figure 3. FTIR point analyses of Sepia officinalis eumelanin, Gansus yumenensis and extant feathers.
(A) Extant Marabou stork feather, (B) Sepia officinalis eumelanin, (C) the dark area of an isolated Gansus yumenensis feather (MGSF317) and its associated matrix (D). *C = O represents a group from a carboxylic acid, **C = O represents a group from either a carboxylic acid or a ketone, NĤ represents a group from a secondary amine; inorganic peaks are shown with a yellow band. (E) Shows the resultant spectra when that of the natural S. officinalis melanin is subtracted from that taken from the dark area of the feather. Vertical dashed lines at 1582 cm-1 represent the C = O group of the ketone or asymmetric stretch of the carboxylic acid, and at 700 cm-1 represents the N-H wagging group of the secondary amine, the blue band represents the OH hydroxyl group.

