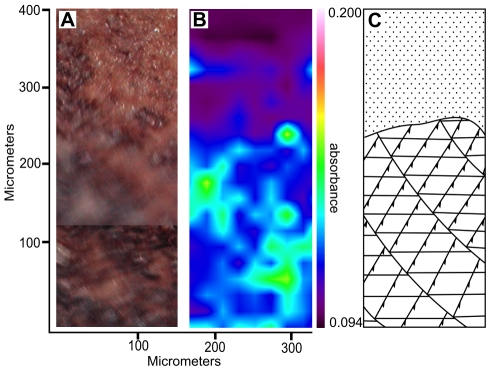
Figure 4. Infra-red absorption map of Gansus yumenensis barbules with corresponding visual image and diagram.
(A) Optical microscope image of a section of barbules of a Gansus yumenensis feather (MGSF317) in reflected light, approximate position on the feather denoted by the yellow dot in figure 1B. (B) A map of infra-red absorption of the carboxylic acid C = O symmetric stretch at 1415 cm-1 of the whole optical image taken in ATR mode. (C) A diagrammatic interpretation of (A) shows the separation of feather barbules (bottom) and sedimentary matrix (top) to guide the eye.

