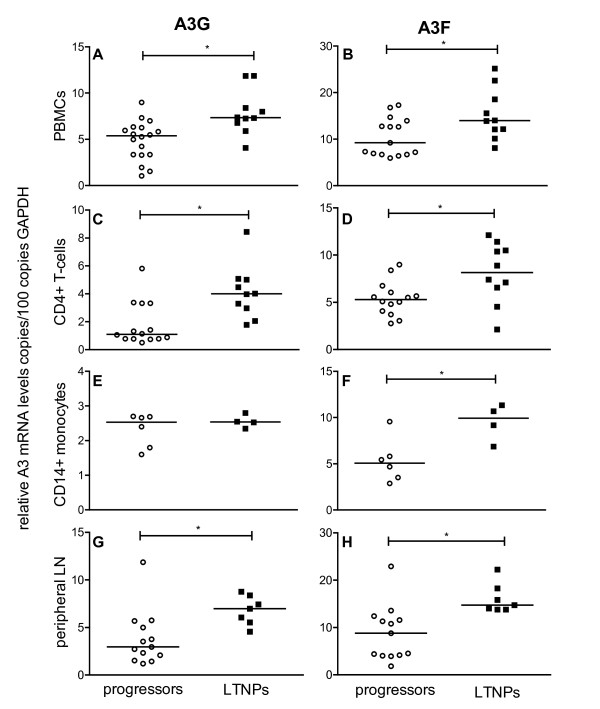
Figure 3.
APOBEC3 mRNA levels in SIV-infected animals with different disease progression. A3G (left panels) and A3F (right panels) mRNA levels were determined in SIV-infected progressors (open circles) or LTNPs (squares). Relative APOBEC3 mRNA levels are shown in copy numbers per 100 copies of GAPDH in PBMC (A, B), CD4+ T-cells (C, D), CD14+ monocytes (E, F) and lymphocytes from peripheral lymph nodes (G, H). Each data point represents one individual animal. Horizontal lines within the clusters are depicting the median. Group differences were calculated using the Mann-Whitney test (*p < 0.05).

