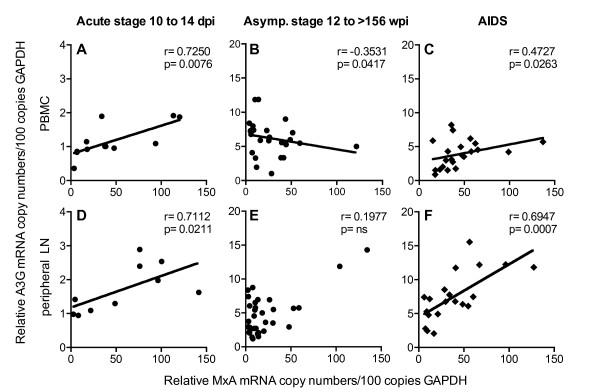
Figure 7.
Relationship between A3G and MxA mRNA levels during SIV disease stages. Relationship between relative A3G and MxA mRNA levels in PBMC (A-C) and in peripheral lymph nodes (D-F) of SIV-infected asymptomatic macaques during acute infection (A and D, 10 to 14 dpi), in SIV-infected asymptomatic macaques during chronic infection (B and E, 12 to >156 wpi) and in SIV-infected macaques with AIDS (C and F). Relative mRNA levels are depicted as copy numbers per 100 copies of GAPDH. Each data point represents one SIV-infected animal. asymp., asymptomatic; r, Spearman's correlation coefficient; line shows linear regression; p, P value.

