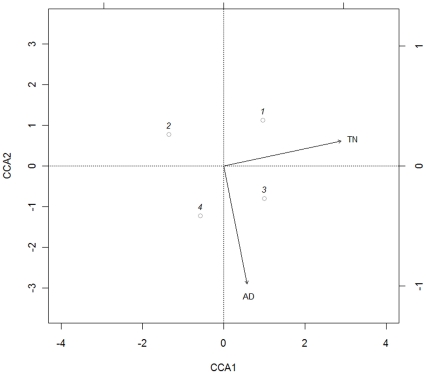
Figure 4. Canonical correspondence analysis ordination diagram.
Ordination of sites along the first two canonical axes and the environmental variables, represented by arrows are showed. AD: tick stage, TN: geographic region. Dots represent sites, i.e. 1: nymph ticks, TN region; 2: nymph ticks, BL region; 3: adult ticks, TN region; 4: adult ticks, BL region. Bacterial taxa were omitted for clarity.

