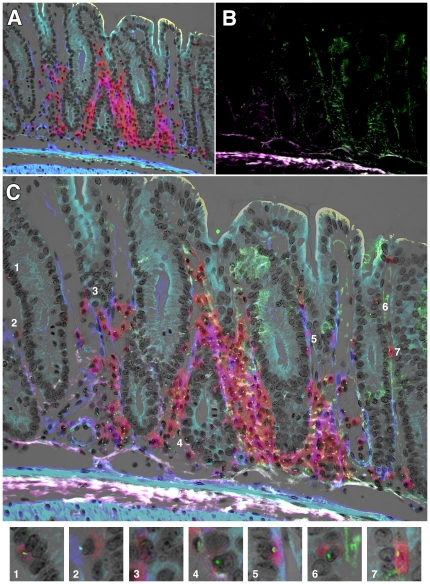
Figure 4. Double IHC with Y chromosome analysis.
A. Double IHC for α-SMA (blue) and CD45 (red) in the colon of a female mouse with GvHD-like syndrome 28 days after male BMTx. Brightfield image (greyscale) overlain with fluorescent blue and red signals. B. Subsequent analysis of Y chromosome signals (green dots) on same section as A, showing some autofluorescence as pale green and white/purple. C. Overlay image of A and B with cells of interest highlighted and shown in Panels 1–7 below. Original magnifications A, B digitally reduced from 200X, C 200X. Panels further enlarged digitally to 600X.

