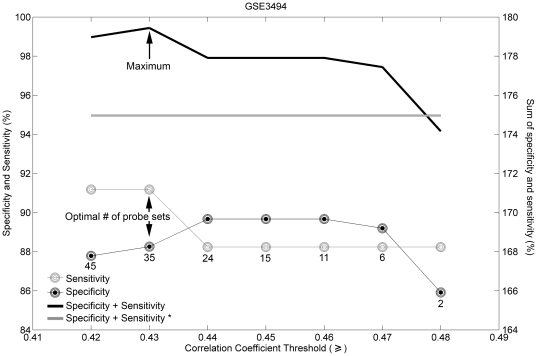
Figure 1. Selecting gene signature predictive of ER status based on sensitivity and specificity.
The cutoff is based on Spearman rank correlation coefficients. The number of probe sets in each signature is marked by the number under the lowest curve. Black filled circles – specificity; gray circles – sensitivity; black line – sum of specificity and sensitivity. The optimal number of probe sets was 35, with Spearman rank correlation coefficient cutoff set at 0.43. Gray line and “*” indicate the sum of specificity and sensitivity of the prediction obtained by using a single “best probe set” (“205225_at”).

