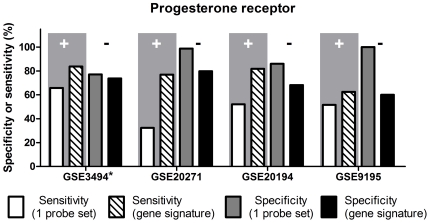
Figure 6. PR status determination: sensitivity (‘+’) and specificity (‘-’) obtained with two different microarray-based methods.
The improved feature is highlighted by gray background. Datasets GSE3494, GSE20271 and GSE20194 were profiled on HG-U133A GeneChips; GSE9195 was profiled on HG-U133 Plus 2.0GeneChips. * Training set.

