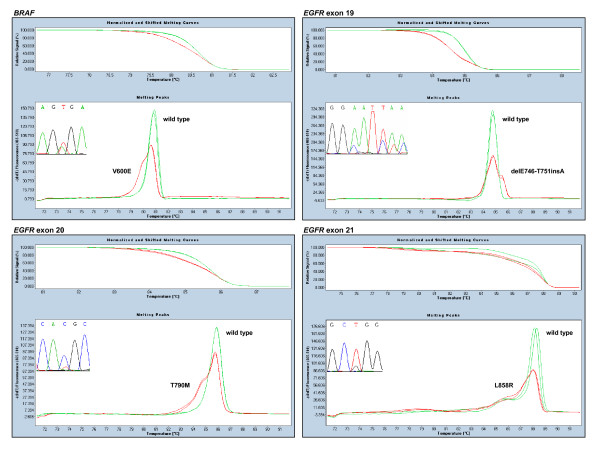
Figure 3.
Panel of HRM assays and sequence traces for BRAF and EGFR. Normalised shifted melting curves and melting peaks of HRM amplicons are compared between wild type (green) and representative mutant samples (red). Mutant samples show left-shifted curves and aberrant melting profiles, with a lower homoduplex peak and a more or less visible heteroduplex peak on its left, except for EGFR exon 19 deletions, in which the sequence of the deleted allele has a higher melting temperature.

