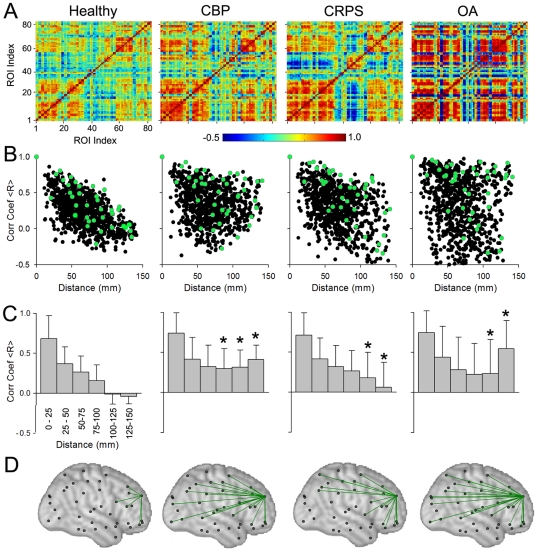
Figure 3. Cortical structural covariance is specific for different chronic pain groups.
A) Structural covariance was studied by calculating pair-wise correlation of GM density between the 82 ROI-s across subjects separately for healthy controls, CBP, CRPS, and OA, after correcting for age, gender, and total intracranial volume. Resultant correlation matrix shows widespread increases in correlation strength in all three patient groups. B) Scatter plots show the left hemisphere pair-wise correlations (for the 41 ROIs) plotted against mean distance between pairs. Healthy subjects show a linear dependency on distance. This relationship is disrupted in unique ways in each chronic pain condition. Green dots indicate the correlation of one example region to the rest of the brain. C) Bar plots are the same data as in (B) after binning distances into 6 ranges, 25 mm each. Mean +/- SD for pair-wise correlation coefficients are shown for each bin, in each group. Patients show higher correlations between ROIs that are far apart (>100 mm apart; asterisks p<0.01 comparing means for each bin to its counterpart in the healthy controls). D) Spatial illustration of changes in correlation for a frontal cortex ROI (same area illustrated in green in B). Significantly strong connections (r>0.6, p<0.05) are plotted (green lines) on standard brain (black marks are centers of ROIs). Strong connectivity is observed with neighboring regions in the healthy group, while all three chronic pain patient groups show enhanced long distance connections.

