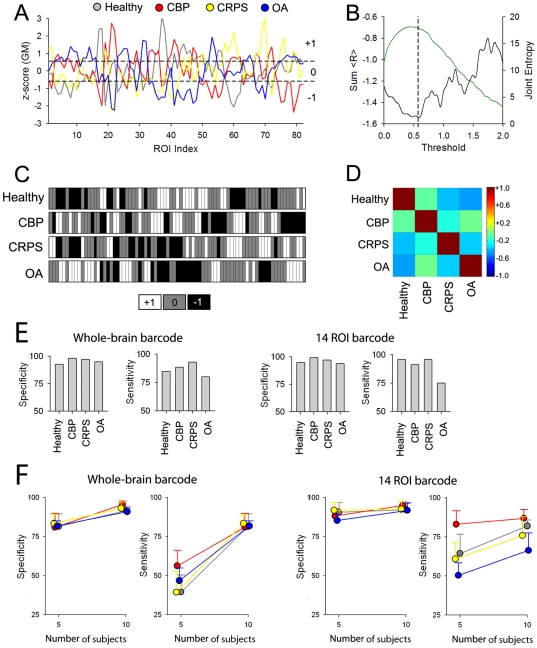
Figure 4. The ROI based GM density profile can be transformed into a barcode and used to classify chronic pain patients with high accuracy.
A) The GM density for each ROI was normalized within subject and averaged for each group. The four groups show distinct variations of GM across the brain. Dashed lines are thresholds implemented to tag ROIs to three different classes, high (+1), average (0), or low (−1) GM values. B) Threshold was selected to optimize the difference between groups. Black trace shows the relationship between the sum of R (the sum of the pair-wise correlations coefficients between the barcodes for the 4 groups) and threshold implemented to generate the bar graphs. The green trace represents the amount of information measured as joint entropy for the 4 groups as a function of threshold. The 4 groups showed the most difference at a threshold of 0.56 (vertical dashed line). C) Group barcodes derived for the data in (A) using the selected threshold. D) Pair-wise correlations across the four groups for the selected threshold. All between groups correlations are negative. E) Sensitivity and specificity of correctly identifying individual subjects to their respective group based on the maximum correlation of each barcode with group barcodes. Left panel is when the whole-brain barcode, shown in C, is used. Right panel is the result when 14 ROIs that best discriminate between the groups (shown in Figure 1C) were used. The procedure shows very high specificity and sensitivity, as random classification would correspond to 25% sensitivity and specificity. F) Dependence of sensitivity and specificity on number of brains used to calculate average barcodes. Whole-brain or 14 ROI-based barcodes derived from a subset of subjects per group (5 and 10 respectively) and classification applied to the rest of the subjects. Shown are mean±S.D. of specificity and sensitivity from 10 iterations for random choices of 5 and 10 subject group barcodes. Specificity exhibited robust results for both tests, while sensitivity seemed to be more dependent on the number of subjects used and the specific group tested.

