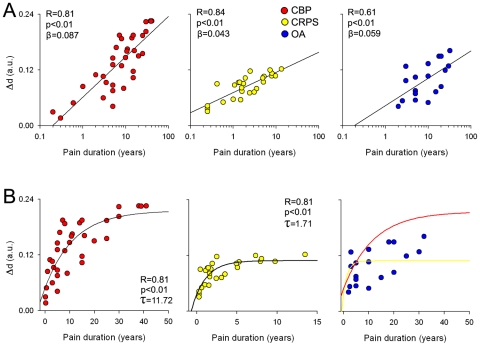
Figure 6. Relating whole-brain GM reorganization to pain chronicity.
A) Scatter plots show the relationship between relative bar-code distances, Δd, for individual patients and duration of chronic pain in CBP (red), CRPS (yellow) and OA (blue). The relative distance was computed as the Euclidean distance between individual patients' location in the ternary plot from the center for the mean of healthy controls (Figure 5A), thus reflecting extent of global gray matter reorganization, where larger distances indicate larger deviations form healthy. All patient groups exhibited a significant correlation between the distance and duration of pain in log scale. B) Same data in A plotted as a linear function of pain duration. Distance relationship to pain duration followed an exponential growth function in CBP (left plot, red circles) and CRPS (middle plot, yellow circles), but not in OA (right) plot. Yellow and red traces in right plot show the best fitted curves for CBP and CRPS respectively.

