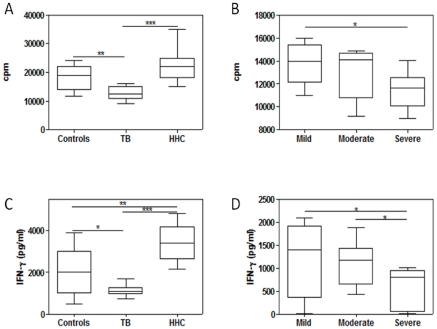
Figure 2. Proliferative responses to mycobacterial stimulation and levels of IFN-γ in 96-h culture supernatants of peripheral blood mononuclear cells from TB patients (n = 47), household contacts (HHC, n = 22) and healthy controls (n = 23).
Patients were separated according to disease severity into mild (n = 10), moderate (n = 18) and severe (n = 19) cases. Box plots show 25–75 percentiles of data values in each group with maximum and minimum values. The line represents the median values. Panels A and C: lymphoproliferative response and IFN-γ production in TB patients, HHC and controls, respectively; Panels B and D: lymphoproliferative response and IFN-γ production in TB patients according to severity, respectively. Overall comparisons by the Kruskall-Wallis test revealed significant differences in lymphoproliferation and 4-day IFN-γ production (p<0.05 and p<0.02, respectively). Significant post hoc Bonferroni comparisons between groups and within TB patients are depicted by *, ** and ***, p<0.05, p<0.025 and p<0.01, respectively.

