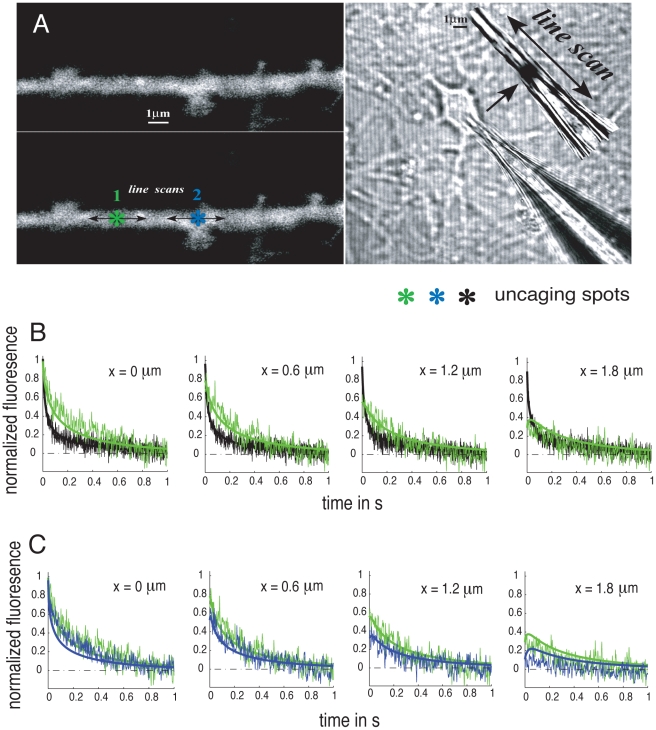
Figure 2.
(A) Images of the dendritic segments and the glass pipette used in the experiments. The sites of the uncaging spots are indicated. (B) Fluorescein transients in the pipette (black) and in the dendritic medium far away from any attached spine (green) at different distances from the uncaging spot. (C) Fluorescein transients in the dendrite near and far away of any attached dendritic spine are shown in blue and green, respectively. Fluorescein was uncaged at the base of the spine at location  . The data are averaged values over several uncaging experiments (
 ). The numerical solutions of the 1D effective diffusion equation are shown as solid lines.

