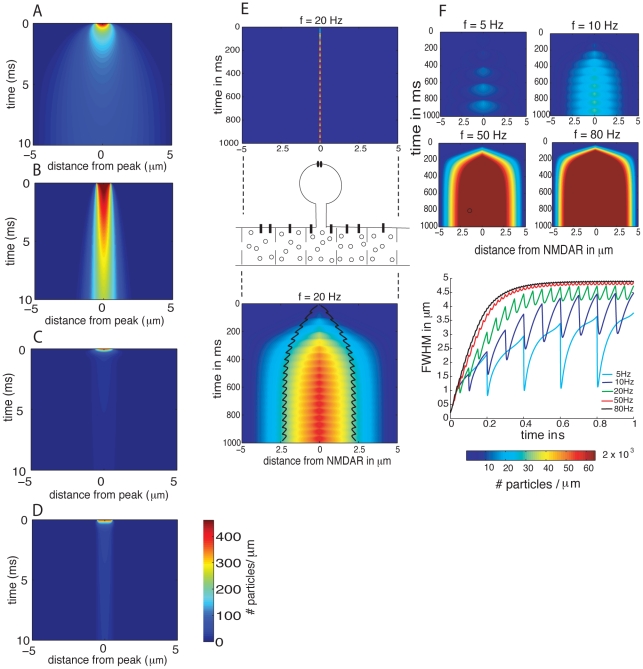
Figure 4.
(A) Calcium diffusion in an aqueous solution contained in a pipette of length  . (B) Calcium diffusion in a crowded dendrite with an effective diffusion constant of
  . A calcium transient of
  was initiated at
  . Note that the initial concentration is equal to about 600 particles per
  and evaluates to about 470 particles per micron for a dendrite with diameter
  . (C) Same settings than in (A) but with additional buffers (medium buffer concentration) and pumps. (D) Same settings than in (B) but with additional buffers (medium buffer concentration) and pumps. (E)
  -influx was injected at
  for 1 s at the location of the NMDAR in the middle of the dendritic segment as shown in the upper and middle panel. The resulting spatiotemporal
  -profile in the dendrite is shown in the lower panel. (F) Spatiotemporal profiles of
  in the dendrite for different influx frequencies at the location of the NMDAR. (G) Corresponding calcium spread in the dendrite as measured by the full width at half maximum (FWHM) of the calcium signal.

