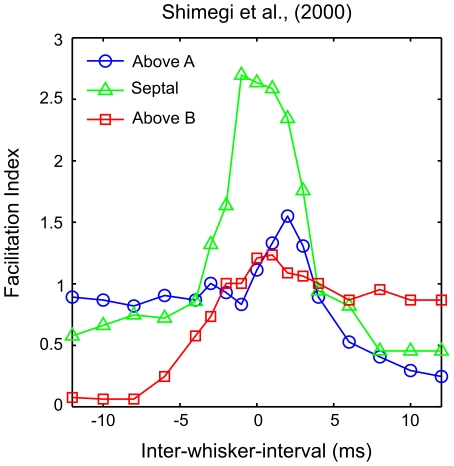
Figure 1. Two-whisker response interactions as reported in ref. [18].
L2/3 barrel cortex neurons were grouped by their position relative to the underlying barrel geometry. The spike rate over 50 stimuli at each inter-whisker deflection interval ( ) is shown as an average for neurons located above barrel A (blue line, open circles), above barrel B (red, squares) or above the septal region between the barrel columns (green, triangles).
  is defined as the time of the whisker A deflection relative to a whisker B deflection at time zero. When the adjacent whisker is deflected after the principal whisker, the response of neurons above the principal barrel is the linear sum of the response to either when deflected independently, as indicated by a facilitation index (
 ) of 1. When the adjacent whisker is deflected prior to the principal whisker, neurons above the principal barrel are strongly suppressed, yielding a
  less than 1 and tending to zero for longer intervals. For neurons located between the barrels, longer intervals in either direction yield suppression with
  around 0.5. However in these neurons, intervals ranging
  to
to  yield responses greater than the sum of the response to either whisker deflected independently and thus
  greater than 1. Notice a smaller positive
  peak in neurons above A when the whisker B deflection precedes by
  . These trends will be used to validate the model. The figure is a visualisation of the data reported in ref. [18], their Figure 8E, obtained from a computer-aided scan; the original error bars and statistical significance indicators are omitted, colour is added, marker styles are changed, and the axes are relabelled for clarity.

