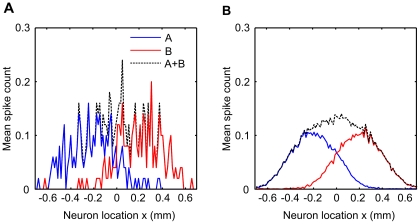
Figure 4. Response to independent deflection of the whiskers.
Whisker A (blue line) was deflected 50 times in separate trials, and the average spike count over trials was measured in neurons at different locations in L2/3. Responses are highly variable, but are largest for neurons located directly above barrel A at  and fall off for neurons further away from the center. Similarly responses to whisker B deflections (red line) fall off with the distance of the neuron from barrel center B at
  . The linear sum of the responses (dashed line) is used later to calculate the facilitation index scores. B Responses are shown as means over 5000 stimulus presentations for clarity.

