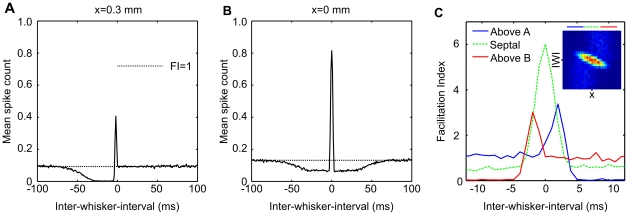
Figure 6. Comparing the neural and simulated data.
A Mean spike response for the individual neuron  stimulated through the range of inter-whisker intervals. Here we show the spike rate as an average over 5000 trials for clarity. The sum of the average response to either whisker deflected independently is shown by the dotted line. At positive intervals, when the principal whisker B is deflected first, responses fluctuate around baseline, whereas for longer negative
  the response is suppressed before recovering at intervals upwards of
  . The peak response for this neuron is at
  . B Equivalent data for a neuron at the midline (
 ). Responses to single and multi-whisker stimuli are symmetrical with respect to the inter-whisker-interval. Responses are suppressed to around 50% of the baseline firing rate for longer
  in either direction but are recovered for
  larger than
  . Peak responses are evoked by simultaneous whisker deflections. These plots are similar to those for individual L2/3 neurons reported in refs. [17], [18]. C Average response interaction for neurons located above or between the barrels. The data in Figure 5C are reproduced in the inset (for
  ranging
  ) and are shown as means over neuron location in the main plot. Means were taken with respect to groups of neurons ‘above A’ (
 ), ‘above B’ (
 ), and ‘septal’ between the two (
 ). The divisions are depicted by the position and length of the coloured bars above the inset. This plot should be compared directly with the electrophysiological data presented in Figure 1. Each of the major trends are reproduced by the model, including the secondary smaller peak in the above A data. In addition the model data contains a peak in the above B data, which is not clearly present in the experimental data.

