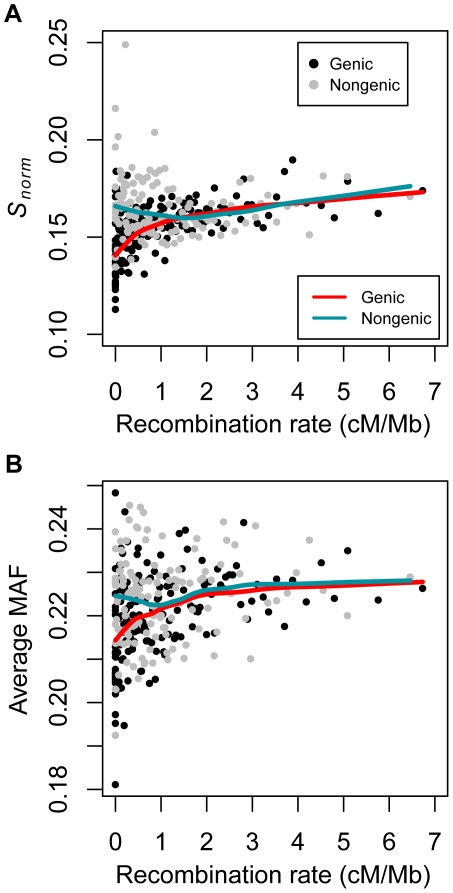
Figure 1. Correlations between summaries of genetic variation and recombination rate in the low-coverage dataset dividing the data into genic and non-genic windows (see text).
(A) Number of SNPs per covered base divided by human-chimp divergence (Snorm) versus recombination rate. (B) Average minor allele frequency versus recombination rate. Red and green lines denote the lowess curves fit to the two variables for genic and non-genic windows, respectively. Black points denote genic windows while gray points denote non-genic windows. Each point represents the average statistics computed over 50 100 kb windows. The windows were sorted by recombination rate prior to binning. Note that several outlier data points fell outside the plotting area.

