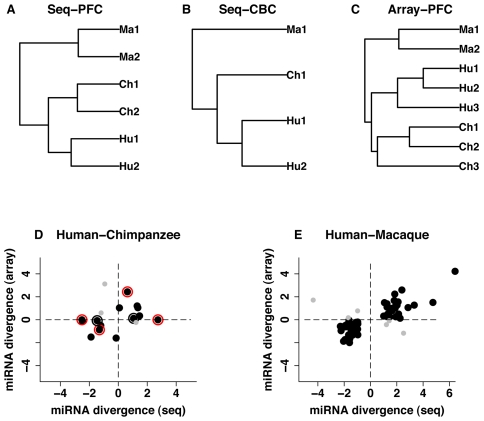
Figure 1. miRNA expression divergence among species and between two brain regions.
A-C, UPGMA dendrograms based on miRNA expression measurements detected in humans (Hu), chimpanzees (Ch) and rhesus macaques (Ma) in at least one sample: (A) prefrontal cortex, high-throughput sequencing (N = 572); (B) cerebellum, high-throughput sequencing (N = 539); and (C) prefrontal cortex, microarrays (N = 325). D-E, miRNA expression divergence (log2-transformed fold-change) measured using microarrays (Array) and high-throughput sequencing (Seq). (D) miRNA with significant expression divergence between human and chimpanzee prefrontal cortex identified using at least one of the two methodologies (N = 17, fifteen miRNA detected by both microarrays and sequencing, two [miR-184 and miR-299-3p] – detected by sequencing and verified by Q-PCR). (E) miRNA with significant expression divergence between human and rhesus macaque prefrontal cortex (N = 61). The black dots indicate miRNA showing consistent expression change directions in the two methodologies; grey dots – miRNA showing inconsistent directions of expression changes; red outer circles – miRNA expression differences confirmed using Q-PCR; black outer circles – unconfirmed miRNA expression differences.

