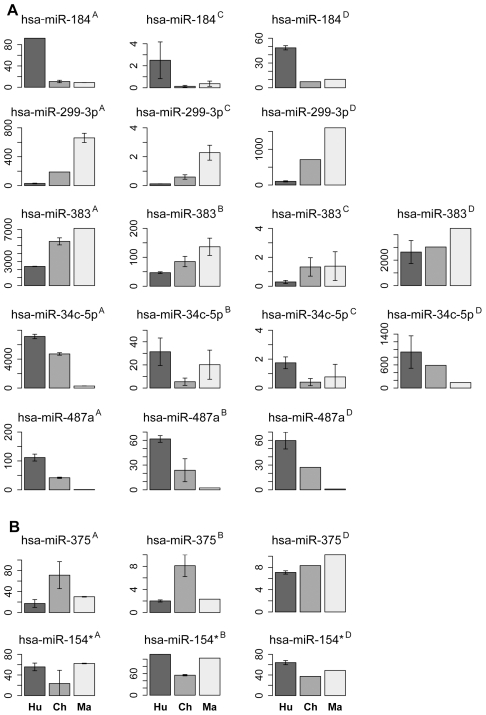
Figure 2. miRNA with species-specific expression in prefrontal cortex.
A, miRNA with human-specific expression profiles in prefrontal cortex confirmed by at least two methodologies. B, miRNA with chimpanzee-specific expression profiles in prefrontal cortex confirmed by at least two methodologies. The panel titles show miRNA identity and the measurement methodology: A - sequencing, B – microarrays, C - Q-PCR, or D - miRNA levels measured using sequencing in cerebellum. The bar colors and labels indicate species: dark grey/Hu – human; grey/Ch – chimpanzee; light grey/Ma – macaque. Note that all miRNA identified as showing species-specific profiles in prefrontal cortex, except miR-375, show analogous species-specific profiles in cerebellum. The expression levels are shown as mean of quantile normalized miRNA reads count for high-throughput sequencing, mean quantile normalized miRNA florescent signal intensities for microarrays or mean Q-PCR cycle numbers normalized to the cycle numbers of invariant internal standard. The error bars show one standard deviation of the measurements.

