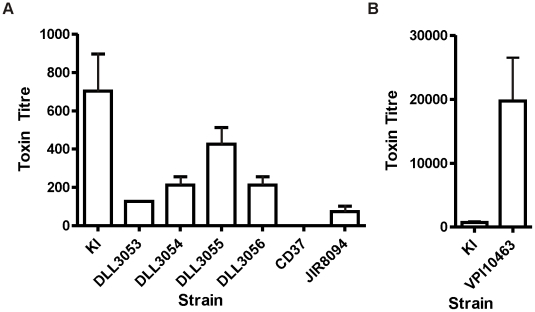
Figure 4. Comparative analysis of toxin production by naturally occurring tcdC clinical isolates.
Vero cell cytotoxicity assays were used to determine toxin production levels. (A) Strain JIR8094 is a tcdC + control strain, CD37 is a PaLoc-negative control strain and KI is an Australian BI/NAPI/027 isolate [36]. All other strains (DLL3053-DLL3056) are clinical isolates carrying naturally occurring tcdC mutations, collected from Australian hospitals. (B) Toxin production by the tcdC + control strain VPI10463 is shown on a separate bar chart due to the much higher levels of toxin produced. For comparative purposes strain KI is represented on both bar charts. Data represent the mean±s.e.m. (n = 3).

