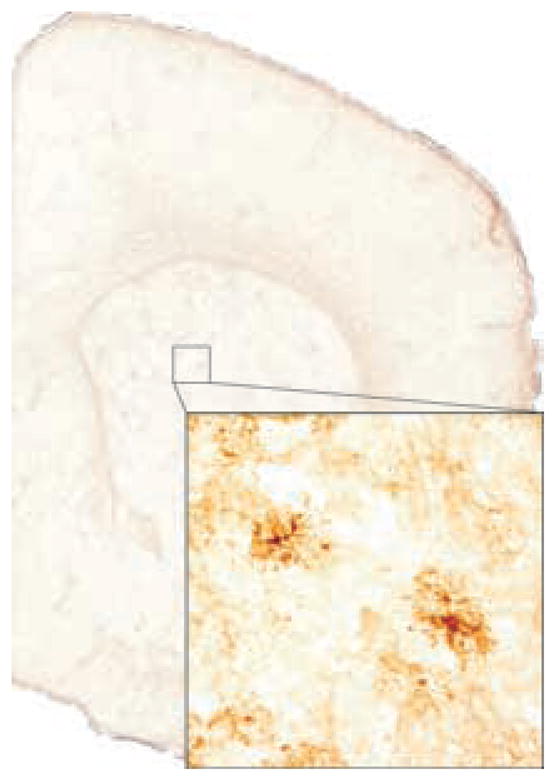
FIG. 4.

Gene expression maps: Immunohistochemistry. A low (0.5×) magnification image of a transverse (coronal) section from a glial fibrillary acidic protein stained volume of a d100 mouse. The inset is a magnified (10×) image demonstrating individual staining astrocytes visible in the dorsal striatum.
