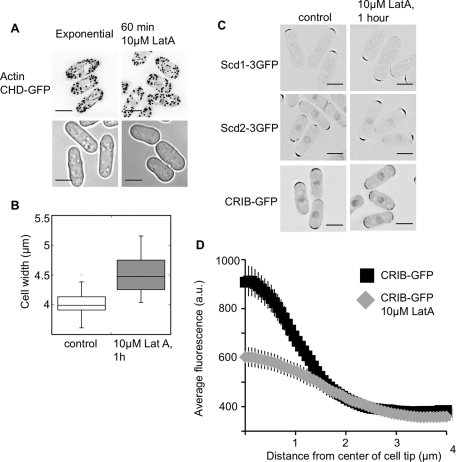
FIGURE 9:
Partial disruption of actin increases cell width. (A) Cells treated with 10 μM LatA have reduced actin cables while retaining polarized actin patches, as shown by CHD-GFP binding to actin in growing cells. Top, images are deconvolved maximum sums across the cell width, with inverted LUTs. Bottom, bright-field images of growing cells, which are wider in 10 μM LatA. (B) Cell width is increased after 1 h of growth in 10 μM LatA. Box-and-whiskers plot, with 50 cells measured for each condition, p < 0.001. (C) Low-level LatA effects on the localization of Scd1, Scd2, and CRIB. Images are deconvolved, single focal planes with inverted LUTs. (D) Low-level LatA reduces CRIB-GFP concentration at the cell tips. Linescan quantification of the distribution of CRIB-3×GFP with and without low-level LatA. Plots show the average intensity of linescans along the cell tip. The scans were done on half tips, aligned by the cell center. Each line is the average of 50 linescans (25 total cell tips) of each genotype. Scale bars: 5 μm.

