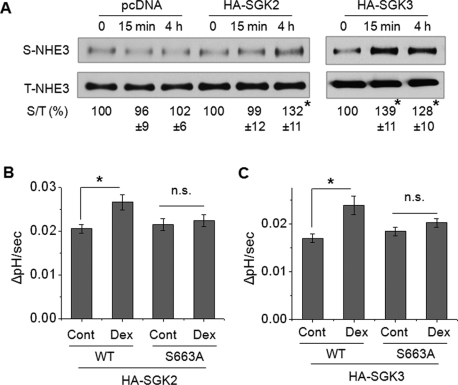
FIGURE 5:
SGK2 and SGK3 increase NHE3 surface expression and the S663A mutation blocks the activation. (A) PS120/NHE3V/pcDNA, PS120/NHE3V/HA-SGK2, and PS120/NHE3V/HA-SGK3 cells were treated with 1 μM Dex for t = 0, 15 min, or 4 h, and the amount of NHE3 protein on the plasma membrane was determined by surface biotinylation, as detailed in Materials and Methods. The amount of surface (S) NHE3 was normalized to total (T) NHE3, and relative changes (%) are shown below the Western blots. n ≥ 3. (B) PS120/OKNHE3/HA-SGK2 and PS120/OKNHE3-S663A/HA-SGK2 cells were treated with 1 μM Dex for 4 h and NHE3 activity was measured. The rates of pH recovery at pHi 6.8 are shown. n = 6. (C) PS120/OKNHE3/HA-SGK3 and PS120/OKNHE3-S663A/HA-SGK3 cells were treated with 1 μM Dex for 15 min, and NHE3 activity was determined. The rates of pH recovery at pHi 6.8 are shown. n = 6. n.s., not significant. *, p < 0.01, compared with the untreated control.

