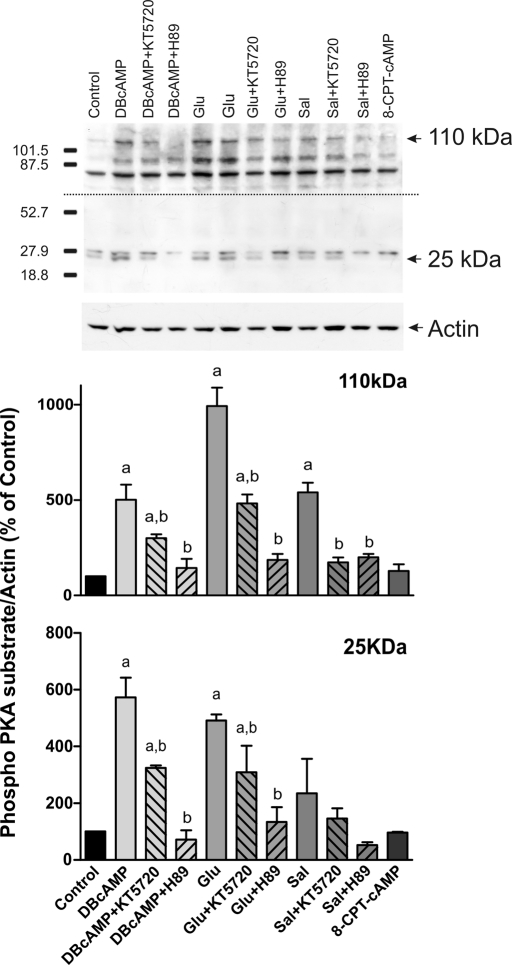
FIGURE 3:
Estimation of PKA activation by Glu and Sal. Isolated rat hepatocytes were incubated with DBcAMP (10 μM, positive control), Glu (0.1 μM), Sal (1 μM), and 8-CPT-2´-O-Me-cAMP (8-CPT-cAMP, 50 μM, negative control) in the presence or absence of PKA inhibitors (50 nM KT5720 or 200 nM H-89). PKA activity was determined by Western blot, using an antibody against phosphorylated PKA substrates. Two bands of 25 and 110 kDa were analyzed based on their response to DBcAMP and PKA inhibitors. Two exposure times were necessary to reveal these bands, a short exposure for the 25-kDa band and a long exposure for the 110-kDa band. Differences in sample loading were corrected by the densitometric signal of the corresponding actin band. The ratio of each phosphorylated substrate/actin band density was compared with that of control bands (100%). Data are expressed as mean ± SEM (n = 3). aSignificantly different from control (p < 0.05). bSignificantly different from the agonist alone (p < 0.05).

