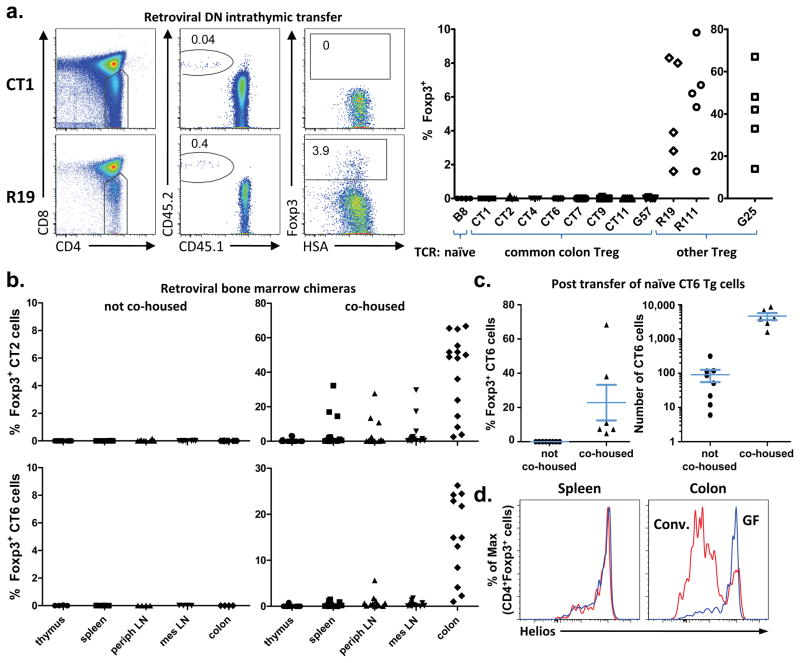
Figure 3. Colonic Treg TCRs facilitate thymic Treg cell development poorly, if at all.
(a) Assessment of thymic Treg cell development from TCRαβ transduced Rag1−/− thymocytes. The gating strategy (left), and summary of 2–4 experiments per TCR (right) is shown. See Supplementary Fig. 3 for additional TCR information, and Supplementary Fig. 8–9 for plots and analysis of clonal frequencies. Comparison of colon versus other Treg TCRs revealed p-values < 0.01. (b) Mixed retroviral bone marrow chimeras. The percentage of Foxp3+ cells in the CT2 or CT6 expressing CD45.2+ CD4+ population is shown in hosts with (right) or without (left) co-housing with mice from our colony. See Supplementary Figs. 10–11 for additional analyses. (c) Peripheral conversion of CT6 TCR transgenic cells. Naive CD45.2 CT6 cells and CD45.1 CD4+ filler cells were adoptively transferred into Tcrb−/− hosts for 5 weeks. The percentage (left) of Foxp3+ CT6 cells (Vα2+Vβ6+CD45.2+CD45.1−CD4+) are shown. The number of CT6 cells (right) was determined by flow cytometry of the entire colonic lamina propria. Data are from 3 experiments; bars represent mean ± S.E.M. See Supplementary Fig. 13 for flow cytometric plots. (d) Helios expression in Treg cells. Representative intracellular Helios staining in CD4+ Foxp3+ cells from conventionally-housed and germ-free Foxp3gfp mice is shown, and summarized in Supplementary Fig. 14. For all plots in this Figure, each symbol represents data from an individual host.

