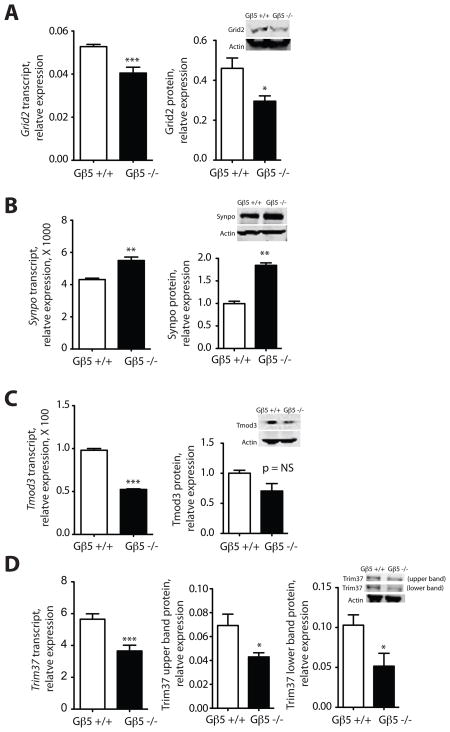
Figure 6. Quantitative analysis of neuronal gene expression in two-week old Gnb5 wild-type and homozygous knockout mice.
Total RNA and protein were harvested from the non-cerebellar brain regions of two week-old Gnb5 KO mice and their wild-type littermates and the expression of transcripts, estimated by quantitative RT-PCR, and protein, estimated by immunoblotting with near-infrared fluorescence quantification, were determined as described in the main and supplementary online Materials and Methods, and shown in the indicated histograms. Inset images (right) show immunoblotting results from a representative experiment. A. Glutamate receptor, ionotropic, delta 2 (Grid2); B. Synaptopodin (Synpo); C. Tropomodulin 3 (Tmod3); D. Tripartite motif containing 37 (Trim37). The upper and lower immunoreactive Trim37 bands were analyzed and are shown separately. (*P < 0.05; **P < 0.01; ***P < 0.0002; versus wt, two-tailed unpaired t-test; NS= not significant; n = 3 to 5 biological samples of total RNA or protein, with mRNA quantification from each biological sample by quantitative RT-PCR conducted in triplicate.)

