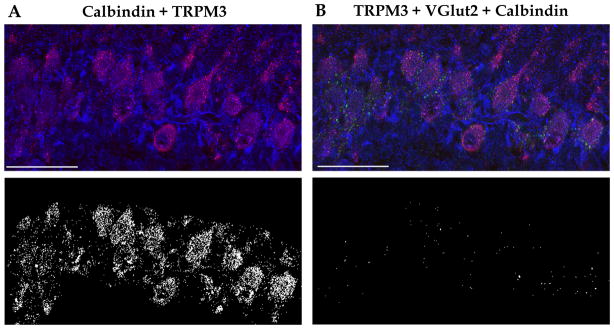
Figure 2. Confocal images and colocalization masks for TRPM3, VGlut2 and calbindin in the PC layer.
(A) Top, merge of calbindin (red) and TRPM3 (blue). Bottom, colocalization of calbindin and TRPM3 is illustrated by masking of regions with no overlap between these proteins. Confocal images correspond to a 1 μm-thick sagittal cerebellar confocal section at P8. (B) Top, merged image of TRPM3 (blue), calbindin (red) and VGlut2 (green). Bottom, colocalization of calbindin, TRPM3, and VGlut2 is illustrated by masking of regions with no overlap between these proteins. Scale bars: 50 μm. See text for quantification of results from 5 separate experiments.

