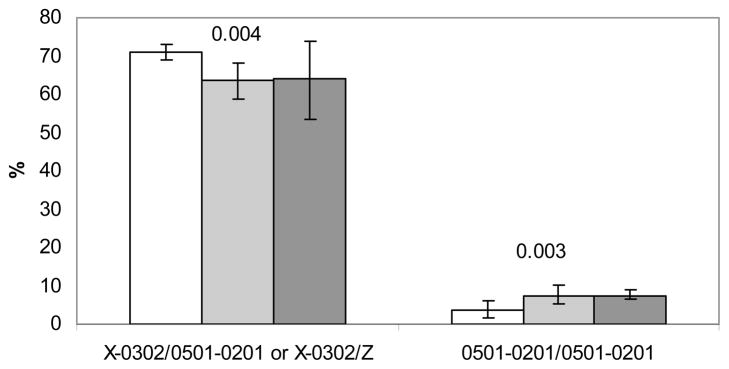
Figure 4. Change in HLA genotype frequency with increasing BMI.
Patients were classified with normal weight (n=1680, white bars), overweight (n=413, grey bars) and obese (n=81, black bars) using ISO-BMI determined after stabilization of diabetes. Proportion of islet autoantibody positive type 1 diabetes patients carrying A1*X-B1*03:02/A1*05:01-B1*02:01 or A1*X-B1*03:02/Z and A1*05:01-B1*02:01/Z genotypes is plotted by BMI class. A test for trend was carried out for each of the genotype groups. X = DQA alleles that have not been genotyped, Z = any DQA1-DQB1 haplotype. Details are shown in Supplementary table 1.

