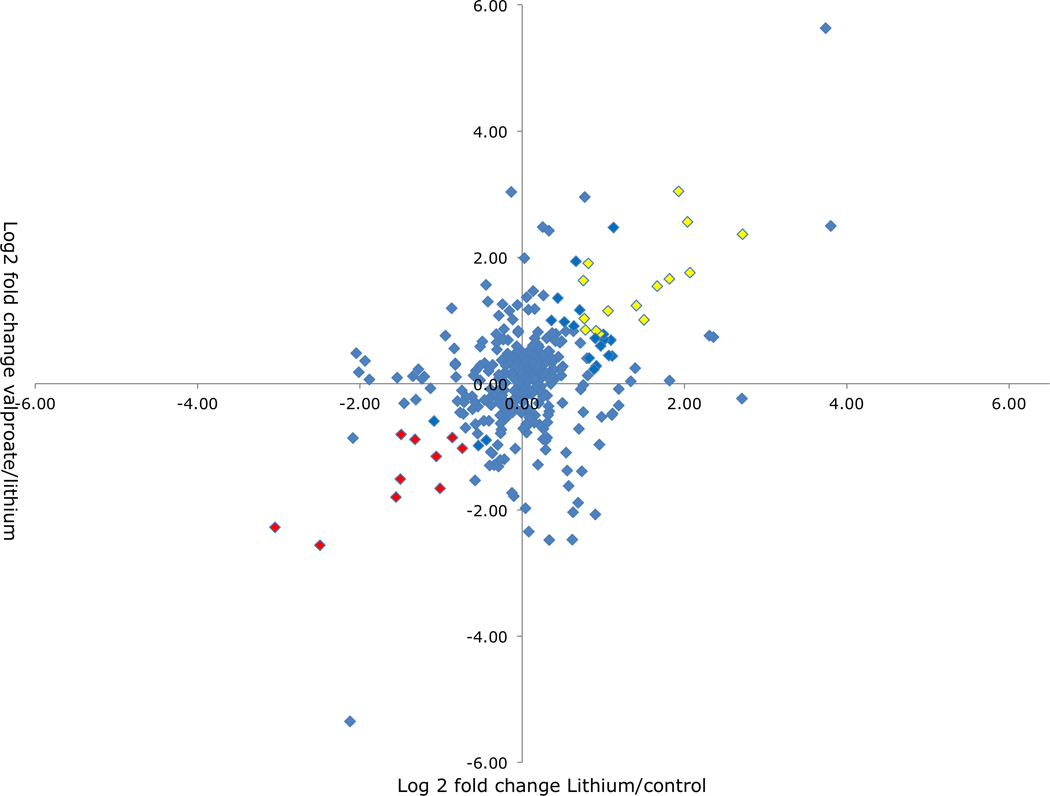
Figure 3. Scatter plot analysis of mass spectroscopy results.

A scatter plot analysis of the log2-fold change in expression of proteins identified in the PSD proteome whose expression is significantly altered following chronic mood stabilizer treatment. Red and yellow indicate proteins that show ± 0.8 log2 fold change and levels are changing in similar direction in both lithium and valproate treatment.
