
Figure 6.
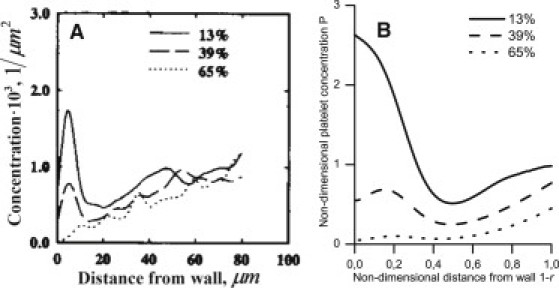
Radial distribution of the platelet-modeling spheres that are 2.5 μm in diameter from experiment (A) and the calculated result (B) at various distances from the tube entrance. (A) The steady-state erythrocyte distribution was established at the beginning of each experiment (19). Next, the flow source was switched to a similar erythrocyte-containing reservoir with a small added mix of spheres. After a few seconds, the flow was rapidly frozen, and the radial profiles for the sphere distribution (spheres/μm2) were measured using fluorescence microscopy. The profiles from a few separate trials were averaged. The axial coordinates for the cross sections are presented as a percentage of the length of an ideal paraboloid that contains spheres at any given time. This length was L0 = 40 μm; the tube length was 50 μm; the tube radius was R0 = 110 μm; and the hematocrit was 40%. (B) The calculation was performed using Eq. 8 (with Eqs. 2, 3, 5, and 6) at Φ0 = 0.4; the p- and f-values were the same as in Fig. 4.