
Figure 2.
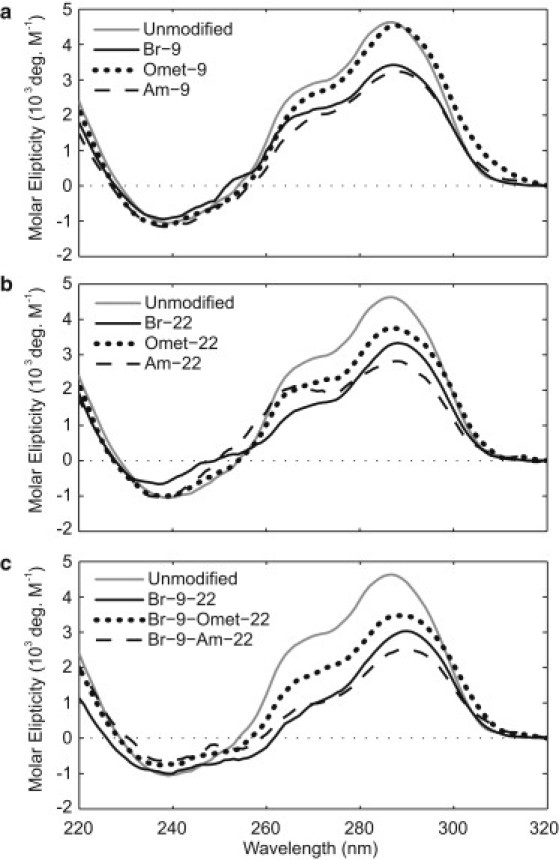
A comparison of CD spectra for sequences containing (a) single substitutions to syn residue 9, (b) single substitutions to anti residue 22, and (c) double substitutions to both syn residue 9 and anti residue 22. The CD spectrum of the unmodified sequence (gray line) is shown as a reference.