
Figure 1.
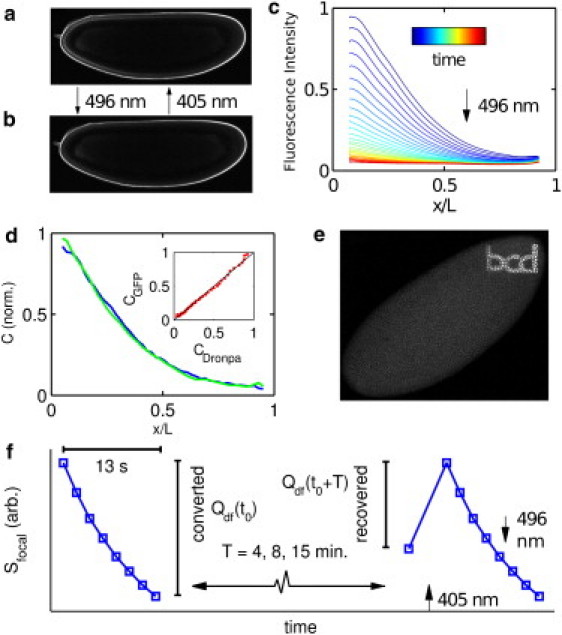
Description of Dronpa-Bcd construct and degradation measurement. (a and b) Confocal images of in vivo Dronpa-Bcd-expressing embryos with Dronpa-Bcd predominantly in the bright (a) or dark (b) state. Switching from bright to dark and dark to bright occurs via 496-nm and 405-nm illumination, respectively. (c) Dronpa-Bcd gradients plotted as fractional anterior-posterior axis position, shown for a sequence of 496-nm images. Imaging effects simultaneous conversion to the Dronpa dark state. (d) Mean anterior-posterior gradients in early cycle 14 of 19 Dronpa-Bcd embryos (blue) and 18 EGFP-Bcd embryos (green) from fluorescence images obtained by confocal microscopy and processed as described in Gregor et al. (3), with background subtraction using Oregon-R under identical conditions. (Inset) Scatterplot of Dronpa-Bcd (CDronpa) versus EGFP-Bcd (CGFP) intensities. (e) Confocal image of a fixed Dronpa-Bcd embryo with Dronpa predominantly converted to the dark state except an inscription produced by a targeted 405-nm reactivation pulse. Species are stable for multiple days. (f) Schematic of degradation measurement, beginning with a Dronpa-Bcd population converted to the dark state, , followed by an interval T and subsequent measurement of the surviving population . Actual values of Qdf are determined by a fitting procedure described in Materials and Methods. Sfocal indicates bright-state Dronpa-Bcd integrated over the region within 14 μm of the embryo surface.