
Figure 4.
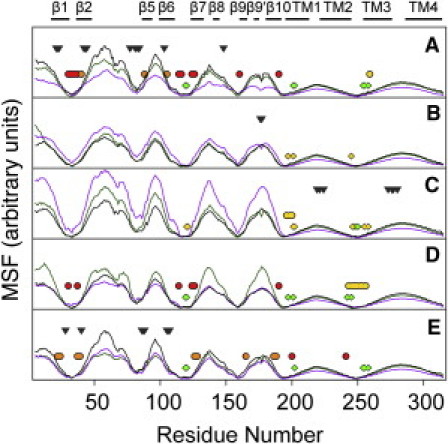
Mean squared fluctuation of the control system (black), system X (purple), and system Y (green) based on three slowest modes of GNM analysis (39,40). Structures after 102-ns simulations were used for GNM analysis. Each residue of GLIC within 3.5 Å of isoflurane for >30 ns in the last 40-ns simulation is marked with a diamond (system X) or a circle (system Y) that are colored the same as isoflurane molecules at each equivalent site shown in Fig. 1. Gray triangles indicate initial isoflurane positions where isoflurane migrated away from the protein during the simulations. The GLIC secondary structure is highlighted at the top of the figure.