
Figure 2.
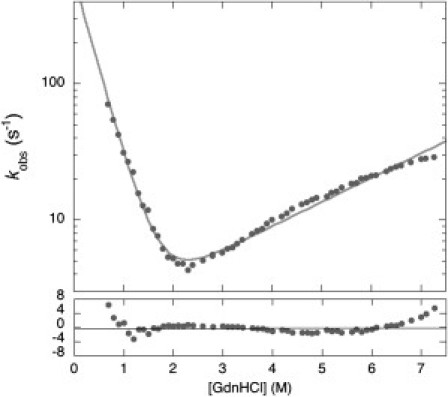
Chevron plot of wild-type GB1 measured at pH 9.0. The gray line is the best fit to a two-state equation; the residuals of the fit below show a clear systematic deviation from the expected values for a two-state behavior. Therefore, data at [GdnHCl] > 5.5 M are critical to detect the rollover effect.