
Figure 1. Subject-specific vaginal flora transition states by weekly visits ordered by the 2-year longitudinal prevalence of BV from lowest to highest.
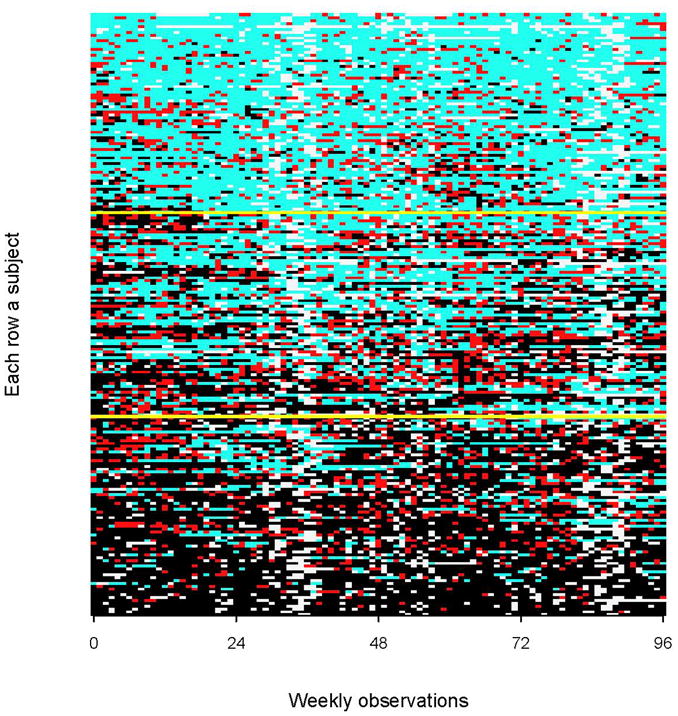
In the graph, light blue boxes correspond to normal flora, red boxes to intermediate flora, black boxes to BV, and off-white boxes to missing visits. Yellow lines divide women based on tertiles of their longitudinal prevalence of BV from lowest to highest.