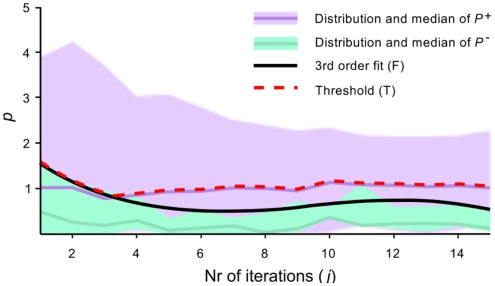
Figure 2.
Visualization of iteration-specific decision threshold. The confidence measure p is plotted for correct (P+) and incorrect (P−) decisions as a function of the number of iterations j. The black line F is fitted to the maximum values of P−. The decision threshold T is defined as the maximum of F and the median of P+.

