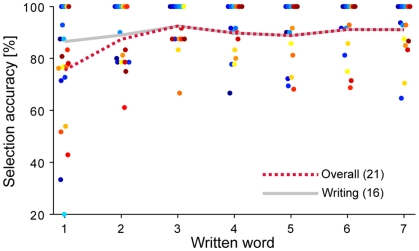
Figure 4.
Accuracy over time. Selection accuracy of Session 1 is plotted for each subject as a function of the word written, which approximates time. The gray line represents the mean over the subjects that finished the entire sentence, which shows no significant slope. The red dotted line represents the mean over all subjects.

