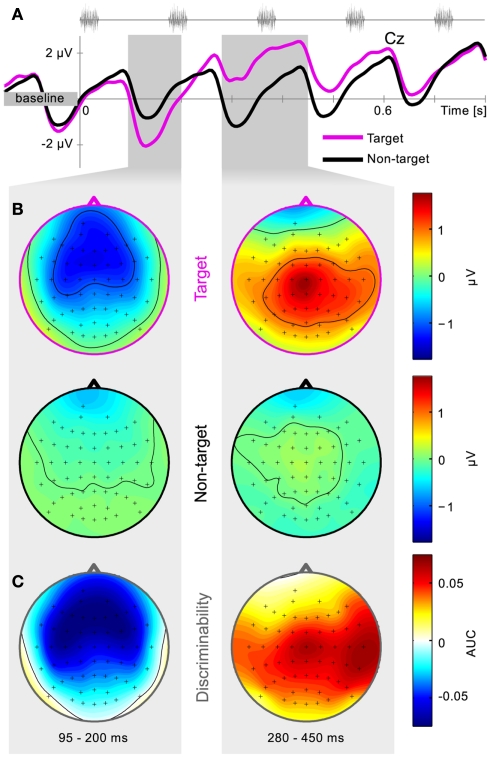
Figure 6.
Grand-average physiology. Calibration data of the first session is collapsed over subjects and trials. Average time series for channel Cz are plotted together with the positions of five consecutive stimuli (A). Scalp potential distributions for target and non-target trials are shown in (B) and distributions of class-discriminative information in (C). Two intervals were hand-picked based on the signed AUC values, and are represented by the shaded gray areas. Early negative components over frontal and temporal regions are followed by a positive component over centro-parietal areas.

