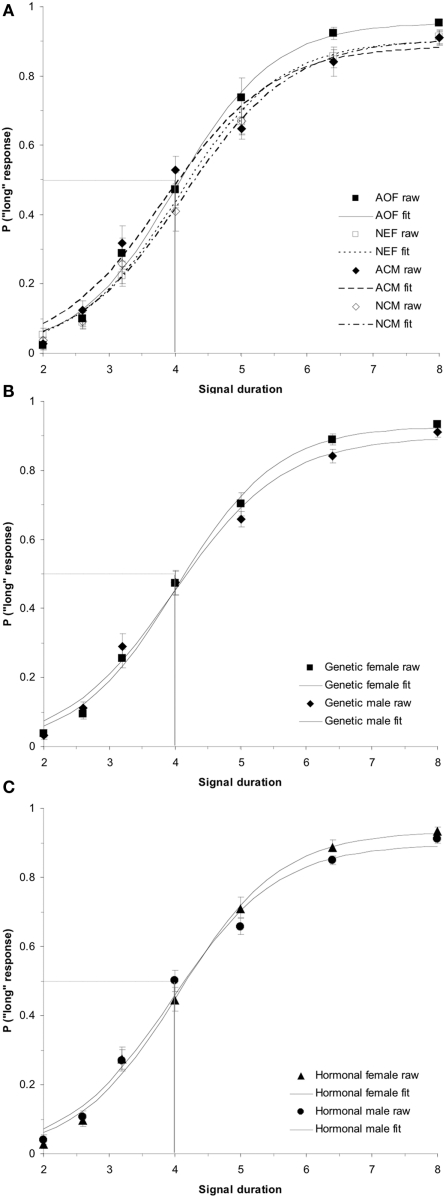
Figure 4.
Phase 2 baseline duration bisection functions. No significant effects were observed in the raw data or sigmoidal fits between (A) treatment groups (p > 0.05); (B) genetic sex (p > 0.05); or (C) hormonal sex (p > 0.05). Probability of a “long” response is plotted as a function of signal duration(s).

